

Investing in individual stocks, especially in financially sound companies, can lead to substantial capital gains while still enjoying high dividend income, outperforming index investments.
While timing the purchase of individual stocks can be challenging amid daily price fluctuations, adopting a long-term investment approach with well-performing diversified stocks allows for flexibility in buying at any time.
Now, how can one identify such promising stocks?
For those seeking straightforward conclusions without the hassle of research and analysis, this article presents specific stocks categorized by industry and provides concise details of their strong financial performance.
We hope this article will serve as a helpful guide, enabling you to confidently and actively engage in the stock market.
Please note that all information provided is accurate as of the time of writing this article.

The Reliability of This Article
This article was written by someone with the following background:
- Over 15 years of experience in real estate brokerage at a well-known major real estate agency
- Successfully closed more than 300 real estate brokerage cases to date
- A certified 1st Class Financial Planner
- A Certified Financial Planner (CFP)
- A licensed Real Estate Transaction Specialist
Understanding Average PER by Industry
In the beginning, I mentioned an extreme argument that you can buy stocks at any time. While that holds true, when there are multiple buying candidates, you’d likely want to purchase undervalued stocks. To gauge the undervaluation at the time of purchase, knowing the average PER (Price-to-Earnings Ratio) and PBR (Price-to-Book Ratio) by industry can be extremely helpful.
PER represents the investment scale that shows how many times the stock price is purchased per net profit per share, while PBR represents the investment scale that shows how many times the stock price is purchased per asset value per share.
Both of these are used as indicators to assess whether the current stock price is expensive or cheap relative to the company’s profit level or asset value. In general, lower PER and PBR values indicate that the stock price is undervalued, and typically, a PER of 10 to 15 times or less, and a PBR of 1 time or less are considered undervalued.
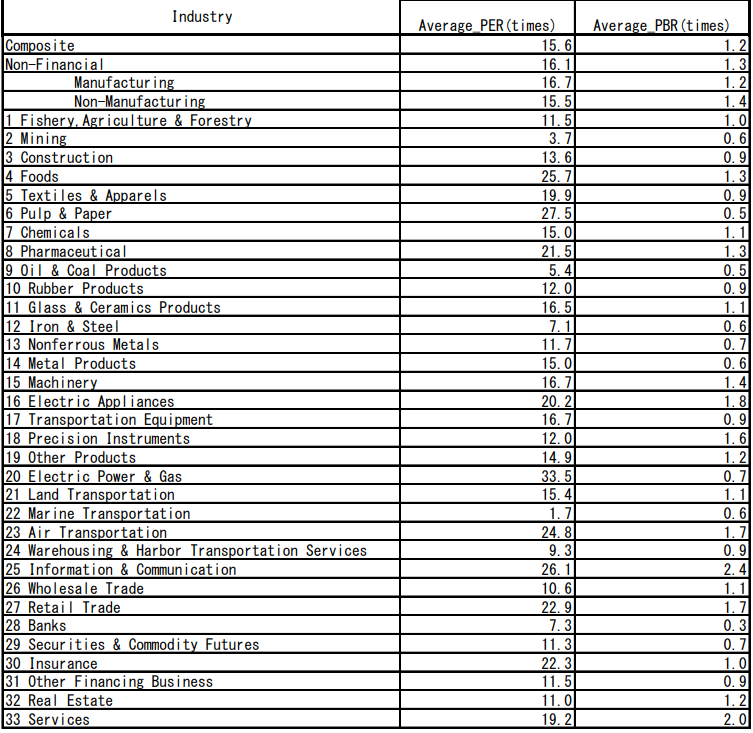
However, since the average values of PER and PBR differ by industry, having a rough idea of those averages allows you to have a proper market perspective and judge whether the current stock price level is undervalued or overvalued.
Below are the averages of PER and PBR by industry in the Prime Market as of the time of writing this article, publicly available from the Tokyo Stock Exchange. By observing this data, you can see that there are significant differences among industries.
Simple Explanation of Must-Know Terms
EPS (Earnings Per Share):
An indicator used in stock investment to measure the proportion of profits. It is calculated by dividing the company’s earnings by the number of outstanding shares. EPS is utilized to assess the profitability and growth rate of a company, with a desirable trend of continuous growth.
Operating Profit Margin:
The percentage of gross profit to total revenue. It indicates the company’s revenue-generating capacity.
Debt-to-Equity Ratio:
The proportion of equity to total capital. The debt-to-equity ratio is used as a financial safety indicator, and generally, a higher ratio suggests better financial health.
Operating Cash Flow:
“Operating Cash Flow” refers to the movement of money in a business, simplistically known as “cash flow.” Operating cash flow specifically refers to the cash inflows and outflows related to business operations, reflecting how well the company is generating profits from its core activities.
Dividend Payout Trend:
By tracking the trend of dividends per share, a rising trend indicates potential stability and growth in future dividend payments.
Dividend Payout Ratio:
The dividend payout ratio shows the percentage of profits a company is distributing to shareholders as dividends from the total issued shares. While a higher ratio may seem appealing, caution is necessary if the payout ratio is excessively high, as it may indicate the company is stretching its profits to pay dividends and warrants attention.
Top Recommended Real Estate and Construction Stocks
The average PER for real estate companies is 11, with an average PBR of 1.2. For construction companies, the average PER is 13.6, and the average PBR is 0.9. Please consider these figures as reference points when making a purchase decision.
Real estate-related and construction-related stocks are representative of domestic demand stocks and are known for their resilience against a strong yen. Additionally, they offer relatively high and stable returns.
HULIC(stock code:3003)

Company Overview
Established as a building management company in the real estate sector, the company has expanded its operations to include real estate leasing services and property redevelopment. Furthermore, it engages in real estate development activities in prime locations within city centers. The company also ventures into upscale hot spring resort development and invests in well-located hotels. With a significant portfolio of office buildings and commercial facilities in prime areas, including Tokyo’s 23 wards and stations nearby, the company is actively involved in real estate projects in highly sought-after locations.
Rating
| Sales Growth Rate | ★★★★★ |
|---|---|
| EPS Growth Rate | ★★★★★ |
| Operating Profit Margin | ★★★★★ |
| Equity Ratio (Equity-to-Asset Ratio) | ★★★☆☆ |
| Operating Cash Flow from Business Activities | ★★★☆☆ |
| Dividend Growth Rate | ★★★★★ |
| Dividend Payout Ratio (Dividend-to-Earnings Ratio) | ★★★★★ |
“Sekisui House(stock code:1928)

Company Overview
The company is engaged in various businesses, including detached housing, rental housing, construction and civil engineering, renovation, condominium development, and urban redevelopment projects.
Rating
| Sales Growth Rate | ★★★★★ |
|---|---|
| EPS Growth Rate | ★★★★★ |
| Operating Profit Margin | ★★★☆☆ |
| Operating Profit Margin | ★★★★☆ |
| Operating Cash Flow from Business Activities | ★★★☆☆ |
| Dividend Growth Rate | ★★★★★ |
| Dividend Growth Rate | ★★★★★ |
Top Recommended Banking Stocks
The average PER for the banking industry is 7.3, and the average PBR is 0.3.
Major banking stocks, including mega banks, are known for their stable profitability. However, they tend to be relatively sensitive to economic conditions, reacting to factors such as interest rate fluctuations and credit risks, which can lead to somewhat significant price movements.
Regarding dividends, banks often distribute a portion of their profits to shareholders, resulting in a relatively higher dividend yield tendency.
Mitsubishi UFJ Financial Group(stock code:8306)

Company Overview
As one of Japan’s three major megabanks, it is widely recognized as a top player in the industry. Mitsubishi UFJ Financial Group was formed through the merger of Mitsubishi Tokyo Financial Group and UFJ Group in October 2005. The company is primarily engaged in banking, trust banking, and securities businesses, as well as credit card services, lending operations, leasing, and asset management. Within the group, core entities include Mitsubishi UFJ Bank, Mitsubishi UFJ Trust and Banking, Mitsubishi UFJ Securities Holdings, Mitsubishi UFJ Nicos, and ACOM, among others.
Rating
| Sales Growth Rate | ★★★★☆ |
|---|---|
| EPS Growth Rate | ★★★☆☆ |
| Operating Profit Margin | ★★★★☆ |
| Equity Ratio (Equity-to-Asset Ratio) | ★★☆☆☆ |
| Operating Cash Flow from Business Activities | ★★★☆☆ |
| Dividend Growth Rate | ★★★★★ |
| Dividend Payout Ratio (Dividend-to-Earnings Ratio) | ★★★★★ |
Sumitomo Mitsui Financial Group(stock code:8316)

Company Overview
Sumitomo Mitsui Financial Group is a “comprehensive financial group” that operates a wide range of businesses, including banking, leasing, securities, credit cards, and consumer finance, among others. It is one of the three major megabanks in Japan. At its core is “Sumitomo Mitsui Banking Corporation,” and it has various group companies such as “SMBC Trust Bank,” “SMBC Nikko Securities,” “Sumitomo Mitsui Card,” “Japan Research Institute,” and “Sumitomo Mitsui DS Asset Management.”
Rating
| Sales Growth Rate | ★★★★☆ |
|---|---|
| EPS Growth Rate | ★★★☆☆ |
| Operating Profit Margin | ★★★★☆ |
| Equity Ratio (Equity-to-Asset Ratio) | ★★☆☆☆ |
| Operating Cash Flow from Business Activities | ★★★☆☆ |
| Dividend Growth Rate | ★★★★★ |
| Dividend Payout Ratio (Dividend-to-Earnings Ratio) | ★★★★★ |
Top Recommended Service Industry Stocks
The average PER for the service industry is 19.2, with an average PBR of 2.0.
Service industry stocks are considered to be sensitive to economic fluctuations. Additionally, as labor costs form a significant portion of their expenses, factors such as labor shortages and wage increases can lead to decreased company profits. On the other hand, since the industry is directly linked to domestic consumption, there is an expectation for stock price growth during economic recovery periods.
The risk of price fluctuations is relatively high.
Gakushūsha(stock code:9769)

Company Overview
The company’s education business primarily focuses on operating cram schools that provide guidance for students preparing for junior high school, high school, and university entrance exams. It expands its operations under the “ena” brand in the Kanto region, North America, and Asia. Additionally, the company manages individualized tutoring services such as “Individual ena” and “ena Home Tutoring Center.
Rating
| Sales Growth Rate | ★★★★★ |
|---|---|
| EPS Growth Rate | ★★★★☆ |
| Operating Profit Margin | ★★★★☆ |
| Equity Ratio (Equity-to-Asset Ratio) | ★★★★☆ |
| Operating Cash Flow from Business Activities | ★★★★☆ |
| Dividend Growth Rate | ★★★★★ |
| Dividend Payout Ratio (Dividend-to-Earnings Ratio) | ★★★☆☆ |
JAC Recruitment(stock code:2124)

Company Overview
Mainly engaged in the human resources recruitment business, operating three segments: domestic human resources recruitment, domestic job advertisement, and overseas business.
Rating
| Sales Growth Rate | ★★★★★ |
|---|---|
| EPS Growth Rate | ★★★☆☆ |
| Operating Profit Margin | ★★★★☆ |
| Equity Ratio (Equity-to-Asset Ratio) | ★★★★☆ |
| Operating Cash Flow from Business Activities | ★★★★★ |
| Dividend Growth Rate | ★★★★★ |
| Dividend Payout Ratio (Dividend-to-Earnings Ratio) | ★★★★☆ |
Top Recommended Energy Stocks
I mentioned “Energy Stocks” for simplicity, but the two recommended stocks below actually belong to the Mining and Electric & Gas sectors.
The average PER for the Mining industry is 3.7, with an average PBR of 0.6. For the Electric & Gas industry, the average PER is 33.5, with an average PBR of 0.7.
These sectors are relatively sensitive to factors like crude oil prices and weather conditions, making their price movements relatively volatile. However, during periods of economic prosperity, they often deliver relatively high returns.
INPEX(stock code:1605)

Company Overview
The largest domestic resource development company. In terms of crude oil and natural gas production, it ranks among the world’s leading companies. It handles energy supply on a global scale, from equity acquisition to exploration, production, and product sales. The company is proactive in new developments and is a strategic government-owned enterprise with the Minister of Economy, Trade and Industry as its major shareholder.
Rating
| Sales Growth Rate | ★★★☆☆ |
|---|---|
| EPS Growth Rate | ★★★☆☆ |
| Operating Profit Margin | ★★★★★ |
| Equity Ratio (Equity-to-Asset Ratio) | ★★★★☆ |
| Operating Cash Flow from Business Activities | ★★★★☆ |
| Dividend Growth Rate | ★★★★☆ |
| Dividend Payout Ratio (Dividend-to-Earnings Ratio) | ★★★★☆ |
J-POWER(stock code:1605)
Company Overview
The company operates in the wholesale electricity sector, mainly focusing on coal-fired and hydroelectric power generation. It uses “J-POWER” as its communication name. Established as a government-funded corporation, it primarily engages in power generation through power plants held by the group. Additionally, it operates a transmission business, transmitting electricity through its owned transmission and distribution facilities to general electricity distribution companies.
Rating
| Sales Growth Rate | ★★★★★ |
|---|---|
| EPS Growth Rate | ★★★☆☆ |
| Operating Profit Margin | ★★★☆☆ |
| Equity Ratio (Equity-to-Asset Ratio) | ★★★☆☆ |
| Operating Cash Flow from Business Activities | ★★★★☆ |
| Dividend Growth Rate | ★★★★☆ |
| Dividend Payout Ratio (Dividend-to-Earnings Ratio) | ★★★★★ |
Top Recommended Insurance Stocks
The average PER for the insurance industry is 22.3, with an average PBR of 1.0.
Insurance stocks are influenced by economic fluctuations, but they are considered capable of generating stable earnings over the long term when viewed with a long-term perspective.
Tokio Marine Holdings, Inc. (stock code:8766)

Company Overview
The largest domestic non-life insurance company. In the overseas insurance business, it has established an extensive network not only in advanced European and American countries but also in emerging economies such as Asia and Central and South America. As part of its financial and other business activities, it operates a highly efficient business centering on asset management.
Rating
| Sales Growth Rate | ★★★★★ |
|---|---|
| EPS Growth Rate | ★★★★☆ |
| Operating Profit Margin | ★★★★☆ |
| Equity Ratio (Equity-to-Asset Ratio) | ★★★☆☆ |
| Operating Cash Flow from Business Activities | ★★★★☆ |
| Dividend Growth Rate | ★★★★★ |
| Dividend Payout Ratio (Dividend-to-Earnings Ratio) | ★★★★☆ |
Top Recommended Telecommunication Stocks
The average PER for telecommunication stocks is 26.1, with an average PBR of 2.4.
Telecommunication-related stocks are often classified as defensive sector stocks and tend to perform relatively well even during economic downturns.
KDDI(stock code:9433)
Company Overview
The company operates mobile communication and fixed-line communication services under the “au” brand. Its main business is in the telecommunications industry. Additionally, it engages in facility construction and maintenance, as well as research and development of information and communication technology.
Rating
| Sales Growth Rate | ★★★★★ |
|---|---|
| EPS Growth Rate | ★★★★★ |
| Operating Profit Margin | ★★★★☆ |
| Equity Ratio (Equity-to-Asset Ratio) | ★★★★☆ |
| Operating Cash Flow from Business Activities | ★★★★☆ |
| Dividend Growth Rate | ★★★★★ |
| Dividend Payout Ratio (Dividend-to-Earnings Ratio) | ★★★★☆ |
NTT(stock code:9432)
Company Overview
The largest domestic telecommunications company. It dominates the regional landline market and is also the overwhelming leader in the mobile phone sector. Additionally, it is expanding its market share in long-distance and international calls.
Rating
| Sales Growth Rate | ★★★★★ |
|---|---|
| EPS Growth Rate | ★★★★★ |
| Operating Profit Margin | ★★★★☆ |
| Equity Ratio (Equity-to-Asset Ratio) | ★★★★☆ |
| Operating Cash Flow from Business Activities | ★★★★☆ |
| Dividend Growth Rate | ★★★★★ |
| Dividend Payout Ratio (Dividend-to-Earnings Ratio) | ★★★★★ |
In Conclusion
In this article, we have provided a concise summary of specific stocks and their financial highlights for each industry, catering to those with limited time for research and analysis.
These stocks have strong financial fundamentals and are suitable for long-term investments.
While U.S. stocks are appealing, it’s also important to pay more attention to the current Japanese stocks.
Please remember that stock investment involves risks, and it’s crucial to make decisions based on your own judgment and research. We hope this information has been helpful to you.
Thank you for reading until the end, and we appreciate your attention.